Data Management in 2026: A Practical Guide for Singapore Teams

Training Courses minutes 9 minutes

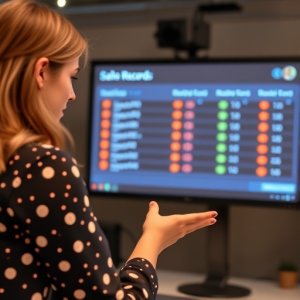
A woman gestures towards a computer monitor displaying a table of sales records with colour-coded statuses in an office setting.Every business in Singapore is now a data business, whether it knows it or not. Invoices, customer records, sensor readings, support tickets, marketing metrics — it all piles up faster than most teams can keep up. The organisations that treat **data management** as a discipline rather than an afterthought are the ones turning that pile into decisions, forecasts and revenue.

This guide walks through the fundamentals of data management for Singapore teams, the tools that make it faster (Excel, Power BI, Python and AI), and a strategy you can implement without hiring a data science department.
What Data Management Really Means in Singapore

Data management is the practice of collecting, storing, cleaning, protecting and using data in a way that stays accurate, secure and easy to find. It is not just "having a spreadsheet" — it is having a system.

In Singapore, three forces make good data management non-negotiable:

- **PDPA compliance.** The Personal Data Protection Act (PDPA) requires organisations to protect personal data, limit how long it is kept, and delete it when no longer needed. Poor data management is a legal risk, not just an operational headache.
- **Smart Nation momentum.** From GovTech initiatives to digital banks, Singapore's economy is built on data flowing between systems. Businesses that manage data well integrate faster with partners and government platforms.
- **Information overload.** The average knowledge worker in Singapore juggles email, chat, CRM and reporting tools daily. Without a clear data structure, people spend more time hunting for numbers than acting on them.

The goal is simple: every dataset your team touches should be accurate, accessible and protected — without becoming a full-time job.

The Data Lifecycle: Five Stages Every Team Should Know

Most data problems trace back to a broken stage in the lifecycle. Understanding the five stages is the fastest way to spot where things go wrong.

1. **Collection** — where data enters your systems: forms, exports, APIs, sensors. Define what you collect and why. Collecting "everything" creates noise and PDPA exposure.
2. **Storage** — where data lives. This could be a shared drive, a database, or a data warehouse. Storage should be centralised enough that there is one source of truth.
3. **Cleaning** — removing duplicates, fixing formats, and filling gaps. Research consistently shows analysts spend 60–80% of their time here, which is why automation (covered below) pays off fastest.
4. **Analysis** — turning clean data into insight. This is where Excel, Power BI and Python come in.
5. **Archiving & disposal** — retiring data when it is no longer needed, on a defined schedule, in line with PDPA retention limits.

A useful habit for Singapore SMEs: write down who owns each dataset, where it lives, and when it should be deleted. That single page is the foundation of a data governance policy

Spreadsheets First: AI Tools for Excel Users

For most Singapore teams, Excel remains the front line of data management — and it has quietly become an AI-powered tool.

Modern Excel (Microsoft 365) now includes features that were once the domain of specialists:

- **Power Query** for importing, merging and reshaping data without writing formulas.
- **Flash Fill and suggestions** that predict what you want to do with a column.
- **AI-powered "Analyze Data"** that answers questions in plain language, such as "which product grew fastest last quarter?"

For heavier lifting, Python is now available directly inside Excel via the `PY()` function. You can run pandas-style transformations without leaving the workbook:

```python
# Inside Excel (Microsoft 365) using the PY() function
import pandas as pd

df = xl("SalesData[#All]", headers=True)
df["revenue"] = df["unit_price"] * df["quantity"] df["month"] = pd.to_datetime(df["order_date"]).dt.to_period("M")
summary = df.groupby("month")["revenue"].sum().reset_index()
```

The lesson: **AI tools for Excel users** have lowered the barrier so that a finance or ops person can clean and analyse data that used to require a developer. That is a genuine **business productivity tool** for a small team.

From Rows to Dashboards: Power BI AI Integration

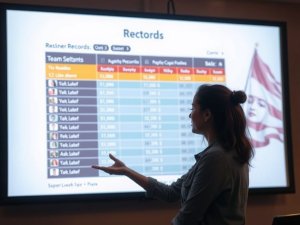
A woman points at a large screen displaying a table of team records and statistics; a blurred flag and face are visible in the background.When spreadsheets hit their limits — too many rows, too many users, too many manual refreshes — Power BI becomes the natural next step. And **Power BI AI integration** has made dashboards far more than static charts.

Key AI capabilities inside Power BI today:

- **Q&A visual** — users type a question and Power BI generates a chart from the underlying model.
- **Decomposition tree** — breaks a metric down dimension by dimension to find the driver of a change.
- **Key influencers** — identifies which factors most affect an outcome, saving hours of trial-and-error charting.
- **AI visuals** (smart narrative) — automatically writes a plain-English summary of what a chart shows.

The workflow that works well for Singapore SMEs is this: use Power Query to clean and model the data once, publish to Power BI Service, and let the AI features handle exploration. The recurring benefit of **AI-Enhanced Data Analysis** is that decision-makers can ask questions themselves instead of waiting for an analyst to produce a report.
Automating the Grind: Python and AI Automation Tools

Data management becomes sustainable only when the repetitive parts are automated. Manual copy-paste between systems is slow, error-prone and demoralising — and it is exactly what **AI automation tools** and a little Python can eliminate.

A typical automation project looks like this:

```python
import pandas as pd
from pathlib import Path

# Combine every monthly CSV in a folder into one clean dataset
files = sorted(Path("exports").glob("sales_*.csv"))
frames = [pd.read_csv(f) for f in files]

df = pd.concat(frames, ignore_index=True)

# Standardise and de-duplicate
df.columns = [c.strip().lower().replace(" ", "_") for c in df.columns] df = df.drop_duplicates(subset=["order_id"])
df["order_date"] = pd.to_datetime(df["order_date"])

# Write a single source of truth
df.to_csv("sales_master.csv", index=False)
print(f"Merged {len(files)} files into {len(df):,} clean rows")
```

This script — about ten lines — replaces a weekly ritual of manually opening files and pasting rows. Multiply that across invoicing, inventory and reporting, and the time saved compounds quickly.

**AI automation tools** add another layer: they can draft the scripts for you, write the regular expressions to parse messy text fields, and explain errors when something breaks. For teams with **Python for beginners** on their training roadmap, automating one manual workflow is the ideal first project.

AI-Enhanced Data Analysis: Cloud or On-Premise?

One of the biggest decisions in modern data management is where the AI runs. Cloud APIs (like the major LLM providers) are powerful, but Singapore businesses handling sensitive customer data often prefer to keep analysis in-house.

The good news: you do not need a data centre to run AI locally. A modest server — or even a workstation with 32–64 GB of RAM — can run open-source models through tools like Ollama or llama.cpp. Here is how you would call a local model to summarise or classify rows in a dataset:

```python
import requests

def local_llm(prompt: str, model: str = "qwen2.5:7b") -> str:
resp = requests.post(
"http://localhost:11434/api/generate",
json={"model": model, "prompt": prompt, "stream": False},
timeout=120,
)
return resp.json()["response"]

summary = local_llm(
"Summarise the top 3 trends in this monthly sales data: "
+ df.to_csv(index=False)
)
print(summary)
```

This approach keeps data within your own network — which aligns with PDPA expectations — while still giving you the productivity lift of AI. The point is not "cloud is bad"; it is that **AI-Enhanced Data Analysis** is now a menu, not a single vendor's product. Choose cloud for speed and scale, on-premise for control and privacy, and use the same Python skills for both.

Common Data Management Mistakes (and How to Fix Them)

Most Singapore teams make the same handful of mistakes. They are easy to spot — and cheap to fix.

- **Duplicate records with no unique key.** Without a canonical ID (an order number, NRIC-hashed client ID, or invoice reference), the same customer appears five times with five spellings. Fix it by defining one key per dataset and de-duplicating in Power Query.
- **Data scattered across drives and inboxes.** When the "latest" sales file lives in someone's email, the pipeline breaks the moment they are on leave. Centralise a single source of truth.
- **No backup or versioning.** One accidental overwrite can erase months of work. A simple 3-2-1 backup habit (three copies, two media, one off-site) prevents catastrophe.
- **Collecting more than you need.** Every extra personal-data field is extra PDPA exposure. Collect the minimum required for the job.
- **No retention schedule.** Data held "just in case" forever is a compliance and storage liability. Set a deletion date when you create the dataset.
- **Departmental silos.** Marketing, finance and ops each keep their own version of the same numbers. Shared, governed datasets beat parallel spreadsheets every time.

None of these require new software — just a decision and a habit.

A Data Management Strategy That Actually Sticks

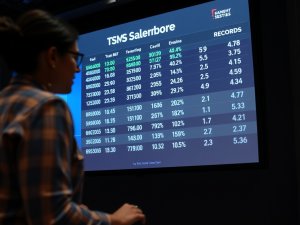
A person stands in front of a large screen displaying a table of sales data, including totals, targets, and percentages recorded by week.Tools are only as good as the habits around them. A durable data management strategy for a Singapore SME does not need to be elaborate — it needs to be specific, owned and reviewed.

Five steps that work:

1. **Name one owner per dataset.** Without a named owner, "everyone's data" becomes "no one's data".
2. **Define one source of truth.** Pick the system that holds the authoritative copy of each metric, and route everything else through it.
3. **Automate the top three manual workflows.** Cleaning, merging and reporting are the highest-return candidates.
4. **Set retention rules.** Write down when each data type is archived or deleted, and make it routine so you stay PDPA-compliant.
5. **Train the team.** Data management fails when only one person understands the pipeline. Short, practical courses close the gap fast.

The organisations that win are not the ones with the most data — they are the ones that can find, trust and act on their data quickly.

Conclusion

Data management in Singapore has shifted from a back-office chore to a competitive skill. With AI now embedded in Excel, Power BI and Python, the gap between "we have data" and "we use data" has never been smaller — or more affordable to close.

Whether you are cleaning a spreadsheet, building your first dashboard, or automating a weekly report, the same discipline applies: collect with purpose, store with structure, automate the grunt work, and protect personal data.

**Ready to put these skills to work?** Visit **www.cbs.com.sg/courses** to browse CBS Training's data and AI curriculum, from Excel and Power BI to Python for beginners and AI automation. Classes start monthly — turn your team's data into decisions.